
![]()
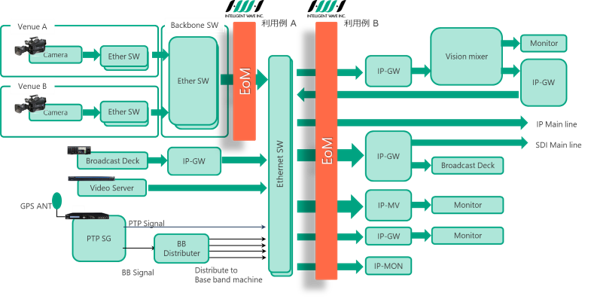
EoM Core visualizes and monitors the communication status of IP flows between bases in real time. It achieves high-speed processing of large amounts of data by utilizing hardware with FPGAs.
IP Flow Monitoring Solution For Broadcasting Industry
In the broadcasting industry, a big shift towards IP transmission is taking place as transferred data gets bigger with the spread of 4K/8K broadcasting*1. EoM monitors latency, jitter and packet drop rate per IP flow and contributes to maintaining the quality of broadcast data.
Product Summary
Main Functions and Features
1.Monitor Multiple Protocols
- SMPTE ST 2110-20/30/40
- SMPTE ST 2022-2/6/7
- NMI(Networked Media Interface)
- PTP/IGMP/AES67/NMOS/VLAN
- NDI(Reliable UDP)
- SRT(Secure Reliable Transport)
- RTMP(Real Time Messaging Protocol)
- SMPTE ST 2110-22(JPEG-XS)
We will also add support for protocols not listed above to meet client requirements.
2.Real-Time Monitoring from Multiple Viewpoints
Users can set the monitoring items, alert notifications, and thresholds from the management portal. EoM monitors not only the packet drop rate, jitter, and latency but also more complex items such as device information and multicast address, etc. which helps determine the cause of a problem.
3.Customizable User Interface
The UI can be customized to each users preference. Integration with DataMiner®*2 is also available.Past data is stored and can be viewed at any time.
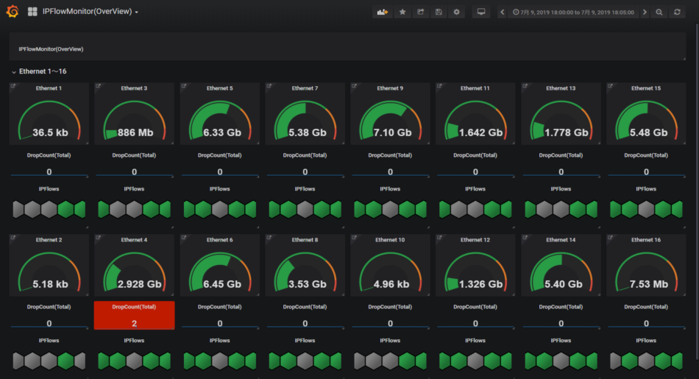
- Overview
The screen below is the OverView screen displaying the condition of the received data for up to 32 ports (16 lines). On this screen, users can monitor the data flow rate, data type and packet drops counts.
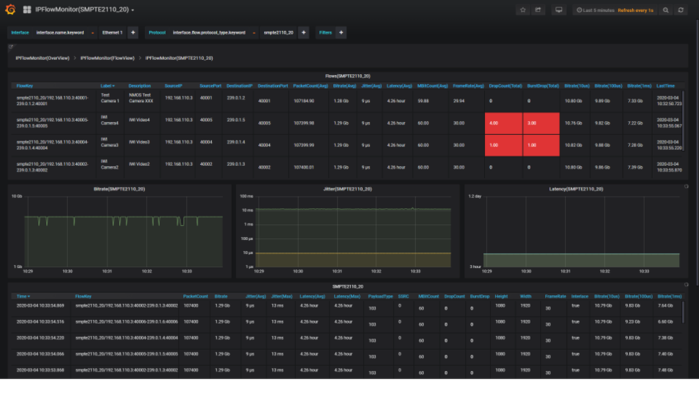
- DetailedView(SMPTE ST 2110-20)
Users can monitor basic information such as IP flow, source IP, destination IP and the quality of traffic as well as various detailed information like micro burst per protocol. Furthermore, with NMOS compatibility, all of the above mentioned IP information can be linked to device names. This allows users to instinctively and precisely detect the location and the cause of problems.
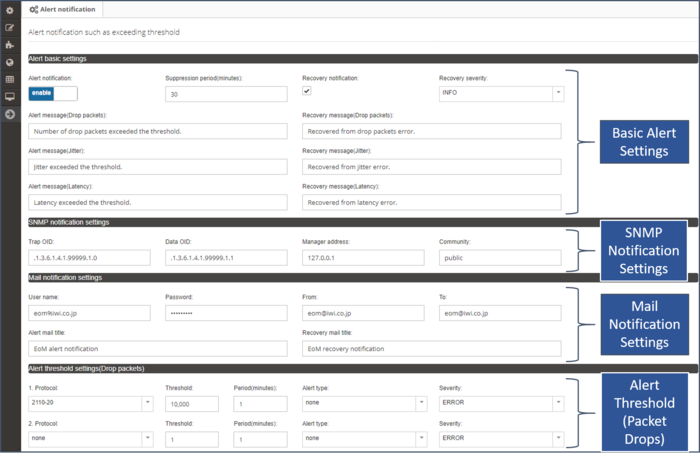
- Alert Notification
EoM Core will monitor the status of each IP flow such as packet drop rate and alerts users if the status exceeds the threshold set by users. Recovery notifications, SNMP trap, and e-mail notifications are also supported.
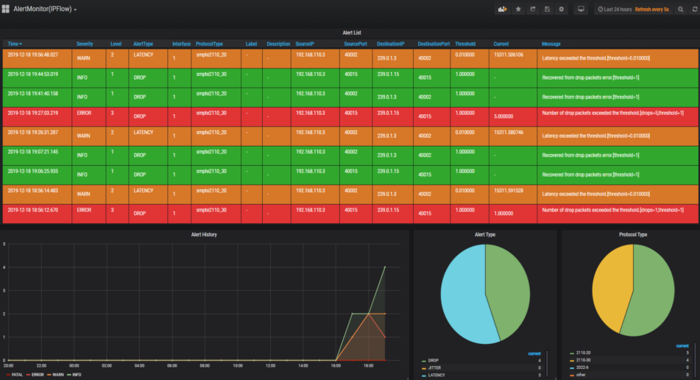
The above three screens are developed on Grafana*3.
Example of Application
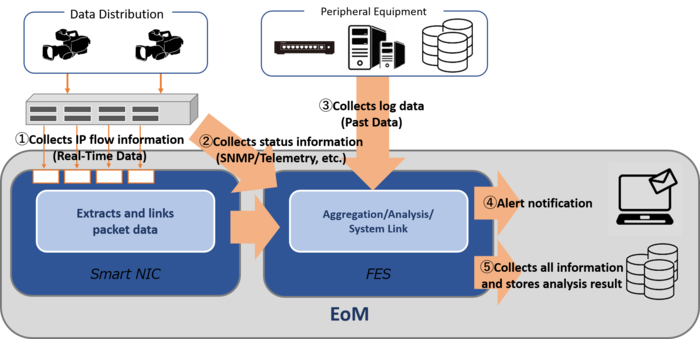
Utilizing peripheral equipment information to detect potential problems (predict problems)
FES, an in-house developed CEP engine, analyzes real-time IP flow data monitored by EoM Core and past productions and test data collected from peripheral equipment. FES analyzes the collected data according to specific rules and predicts problems based on the real-life operation.
Products

Note
*1: The interface of TV program production system is shifting from SDI(Serial Digital Interface)to IP(Internet Protocol).
*2: End-to-end multi-vendor network management & OSS solution made by Skyline Communications
*3: Open source visualization and analytics software made by Grafana Labs
*4: Low latency L1 switch with FPGA made by Arista Networks
*5: Accelerator cards made by Xilinx
